TL;DR: Use Google Apps Script to turn your Google Sheets data into a professional web dashboard — no database, authentication, or hosting required.
Google sheets is the go-to tool for maintaining records, planning and tracking progress. On top of that, one can create charts for data analysis and patterns observation.
Converting the records and data into meaningful charts often feels time consuming with limited Google Sheets in-built chart features.
Kabir had automated his team's sales reporting using Google Sheets and Apps Script.
If you don't know the story of Kabir, read it here: The Day I Realised Sheets Can Be Smarter
As the team and data grows, he needs more visibility across sales data.
Kabir's problem can be easily over-engineered by creating a web app with a database and auth support.
But wait, does this require spending so much time on such a small thing?
I don't think so!
Who wants to manage authentication, database, deployment, and codebase for such a small use case?
I didn't want to, and neither did Kabir!
This is where, I tried to find a generalised solution.
Can't I convert the sheets data into insights?
Does any solution exist?
Yes, the answer is Google Apps Script, which provides us with this functionality.
. . .
To speed up the process, I used Gen AI and used the prompt for generating the code.
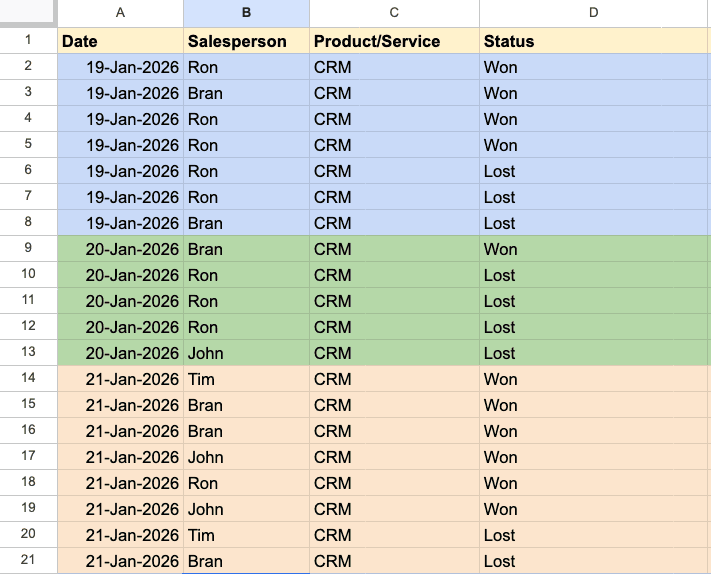
Build a professional dashboard for sales intelligence using Google Apps Script from Google Sheets containing Date, Salesperson Name, Deal Status (Won/Lost). The Dashboard should have:
- A consolidated view of total deals, won, lost, conversion rate, and plot on the monthly graph view.
- Filters for monthly and salesperson levels.
- Monthly leaderboard for salesperson.
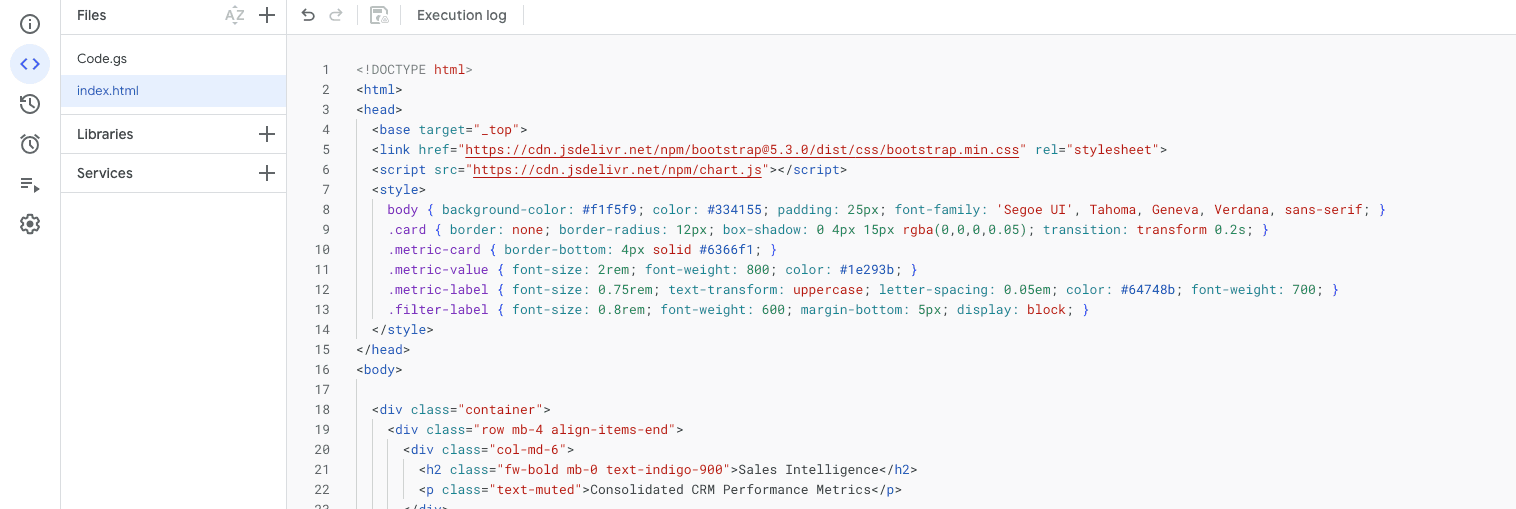
As a result, backend functions along with HTML code were generated.
I pasted backend functions in the code.gs & HTML code in index.html editor and saved it.
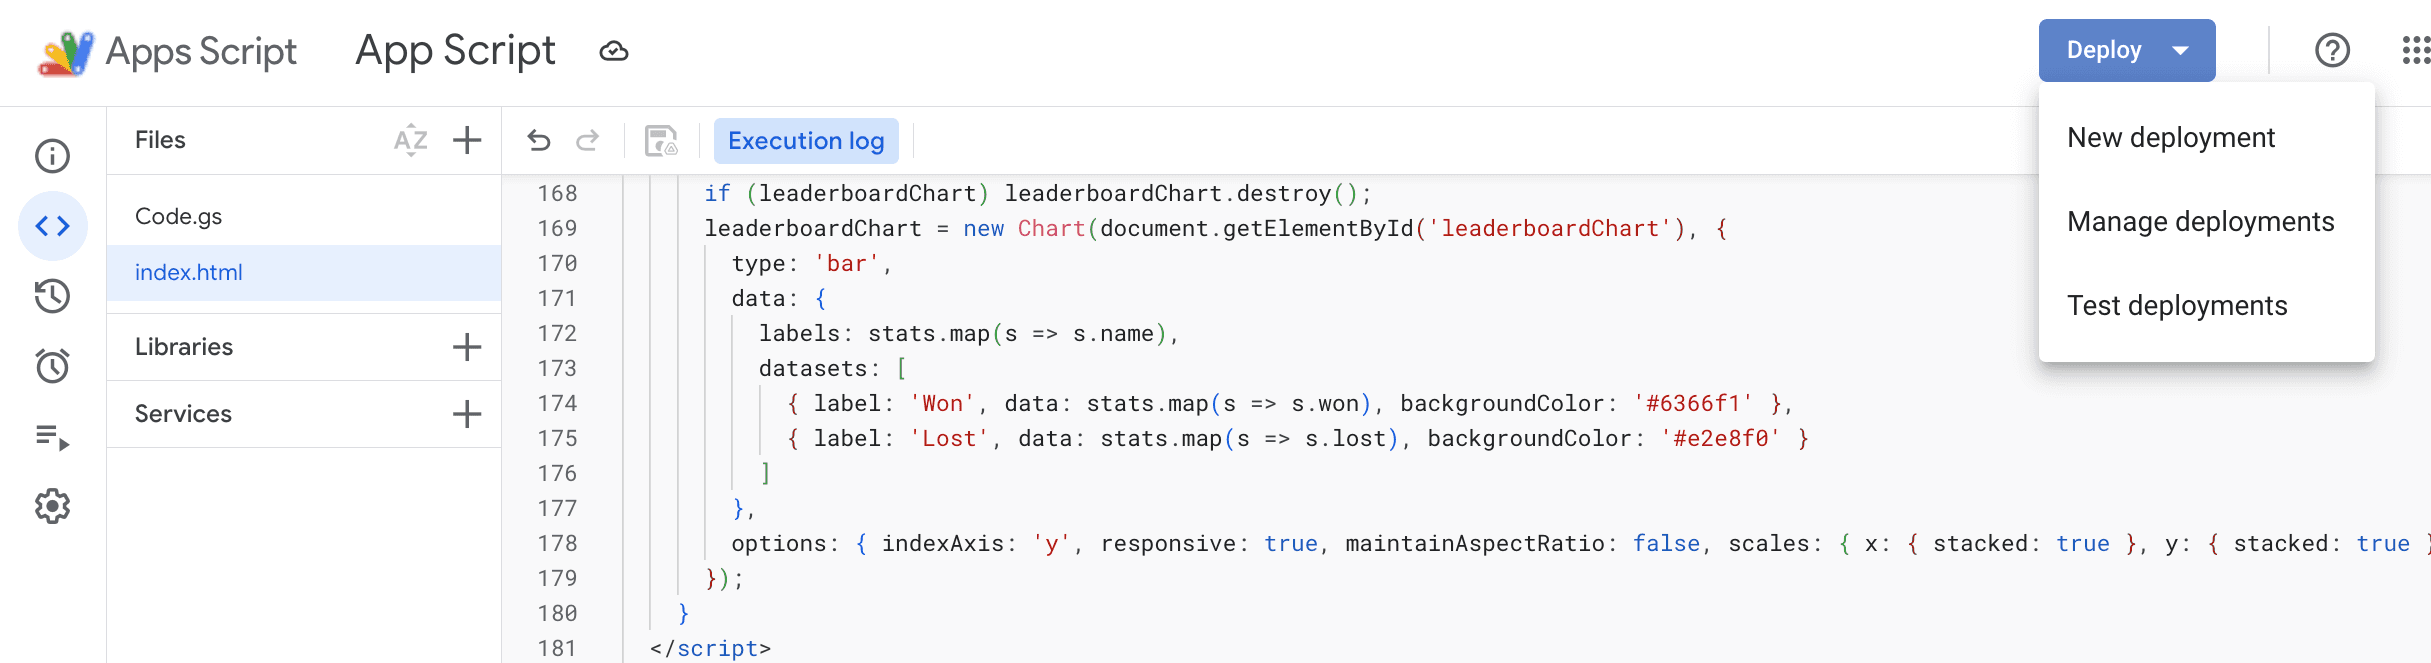
To use this dashboard as a web app, I deployed using in-built deploy feature.
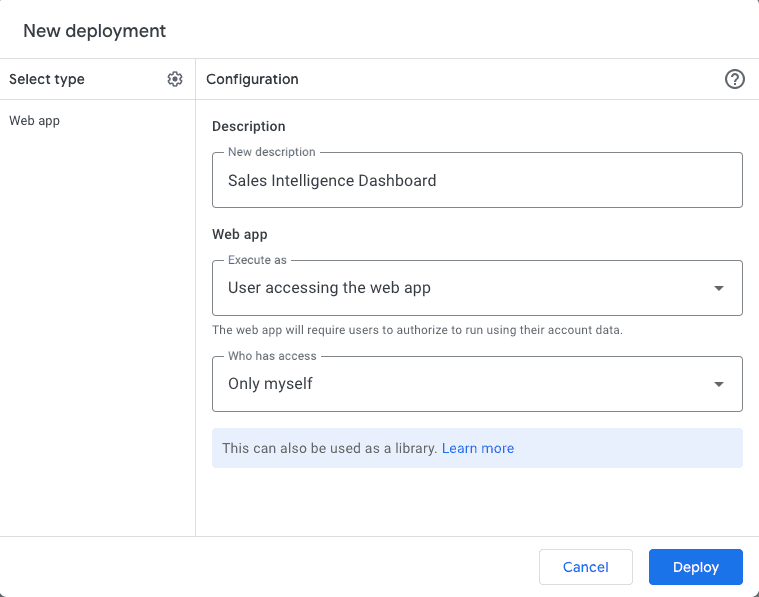
Deploy > New deployment
Filled in the basic details, like description, who can access the dashboard, and deployed.
Boom!!! The link to the Sales Intelligence Dashboard is READY!!!
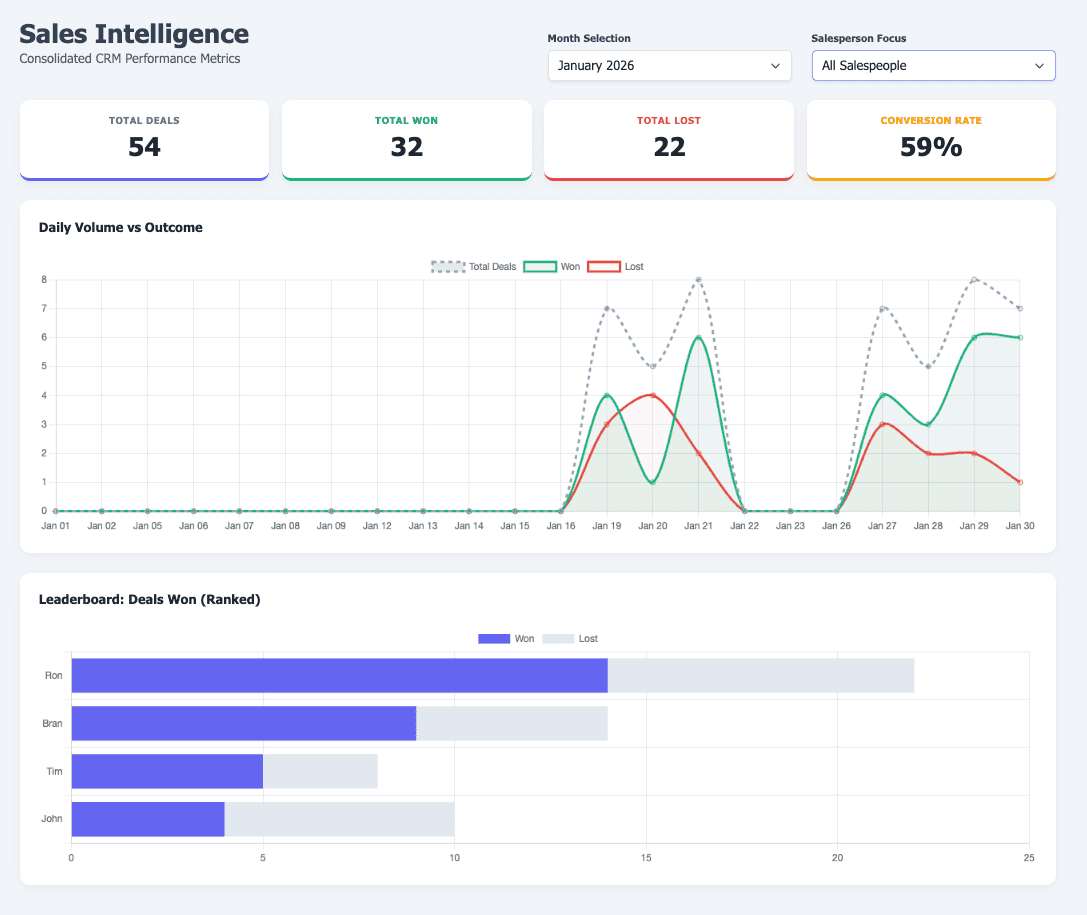
One can switch between salesperson and month from the filter as requested, and use it for better visibility.
Did we require any auth setup?
NO, Google manages it from Who can access it option.
Did we require any database?
NO, Google Sheets acts as a database.
Did we require any hosting?
NO, in-built deployment helped here.
With such a simple flow, anyone can convert their Google Sheets into an interactive dashboard and become a STAR Employee of the Month 🌟
. . .
Conclusion
Using this, I created an interactive budget management system that powers an interactive dashboard.
You can check it here: Interactive Budget Tracker
I hope you learned something different from this article and are now ready to make your Google Sheets more interactive and insightful.